AI-based Predictive Wildlife Detection for the French National Railway SNCF Réseau

Summary

The aim of the research project, which is being carried out at FHNW in collaboration with SNCF Réseau, is to use artificial intelligence (AI) and an integration of multimodal data (multispectral satellite time series, aerial images, agricultural and climatological information, as well as data from terrestrial sensors) to model the residence probabilities of wildlife in the vicinity of the track infrastructure of the SNCF network.

The resulting predictive habitat models will help to better prevent incidents, for example through appropriate construction measures in specific risk areas.

In this Big Data project, the latest Machine Learning technologies are to be applied in order to process the extremely exhaustive and demanding data sources and establish profitable correlations from the processing.

The project is based on many years of recognized experience at the FHNW Institute of Geomatics in AI-based approaches to detection, classification tasks and modeling in the field of spatially and temporally referenced geodata.

Introduction

In a collaborative effort the researchers Adrian Meyer (Geodata Scientist and Animal Biologist) and Denis Jordan (Professor for Applied Mathematics) launched a project in 2023 together with Pascal Baran at SNCF Réseau, the infrastructure branch of France’s national railway society. The team is harnessing the power of machine learning to tackle a growing problem on the tracks: Wildlife-related accidents.

Accidents involving wild animals, particularly boars and deer, pose a significant risk to the extensive French railway network. They not only cause ecological, safety and property concerns but also contribute to significant financial costs, estimated at up to €100’000 per incident on the high-speed lines, while totaling over 200’000 minutes of schedule delays each year. Traditional methods for avoiding such accidents, such as fencing, wildlife crossings, and scaring devices are resource-intensive and not always effective, as it’s challenging to predict wildlife hotspots.

However, the team aims to revolutionize this process by creating a comprehensive wildlife accident risk prediction system. Utilizing a range of data sources, they are developing a dynamic predictive model that uses novel machine learning algorithms to assess the risk of animal presence in specific areas. This information will allow for more precise, cost-effective interventions, potentially reducing accidents and boosting network reliability and safety.

The models will integrate imagery from aerial and satellite remote sensing datasets, track-based mobile mapping photography, and infrared imagery from drones and camera traps. This data will be used to train a predictive multimodal fusion model that generates localized risk scores, highlighting potential wildlife hotspots. When converted into maps, these risk scores will provide a vital tool for planning mitigation actions.

This project is a response to the recent sharp rise in wildlife incidents on France’s railways, which comprise around 30’000 km of lines. The country-wide scale calls for modern geospatial database structures employing effective Big Data strategies. With around 1’500 regularity incidents linked to wildlife encounters impacting roughly 8,000 trains as of 2020, the SNCF has recognized the need for an innovative solution.

The ultimate goal is a flexible software prototype capable of predicting animal presence across large portions of the SNCF network. It will calculate a collision risk factor for small scale sections on each track, providing a multitemporal localized information basis for processes like barrier constructions, implementation of wildlife crossings, or interventions such as scaring devices and population management.

The results generated in this project will mark a significant step forward in the intersection of technology and wildlife management, while enhancing the safety and reliability of the French railway operations.

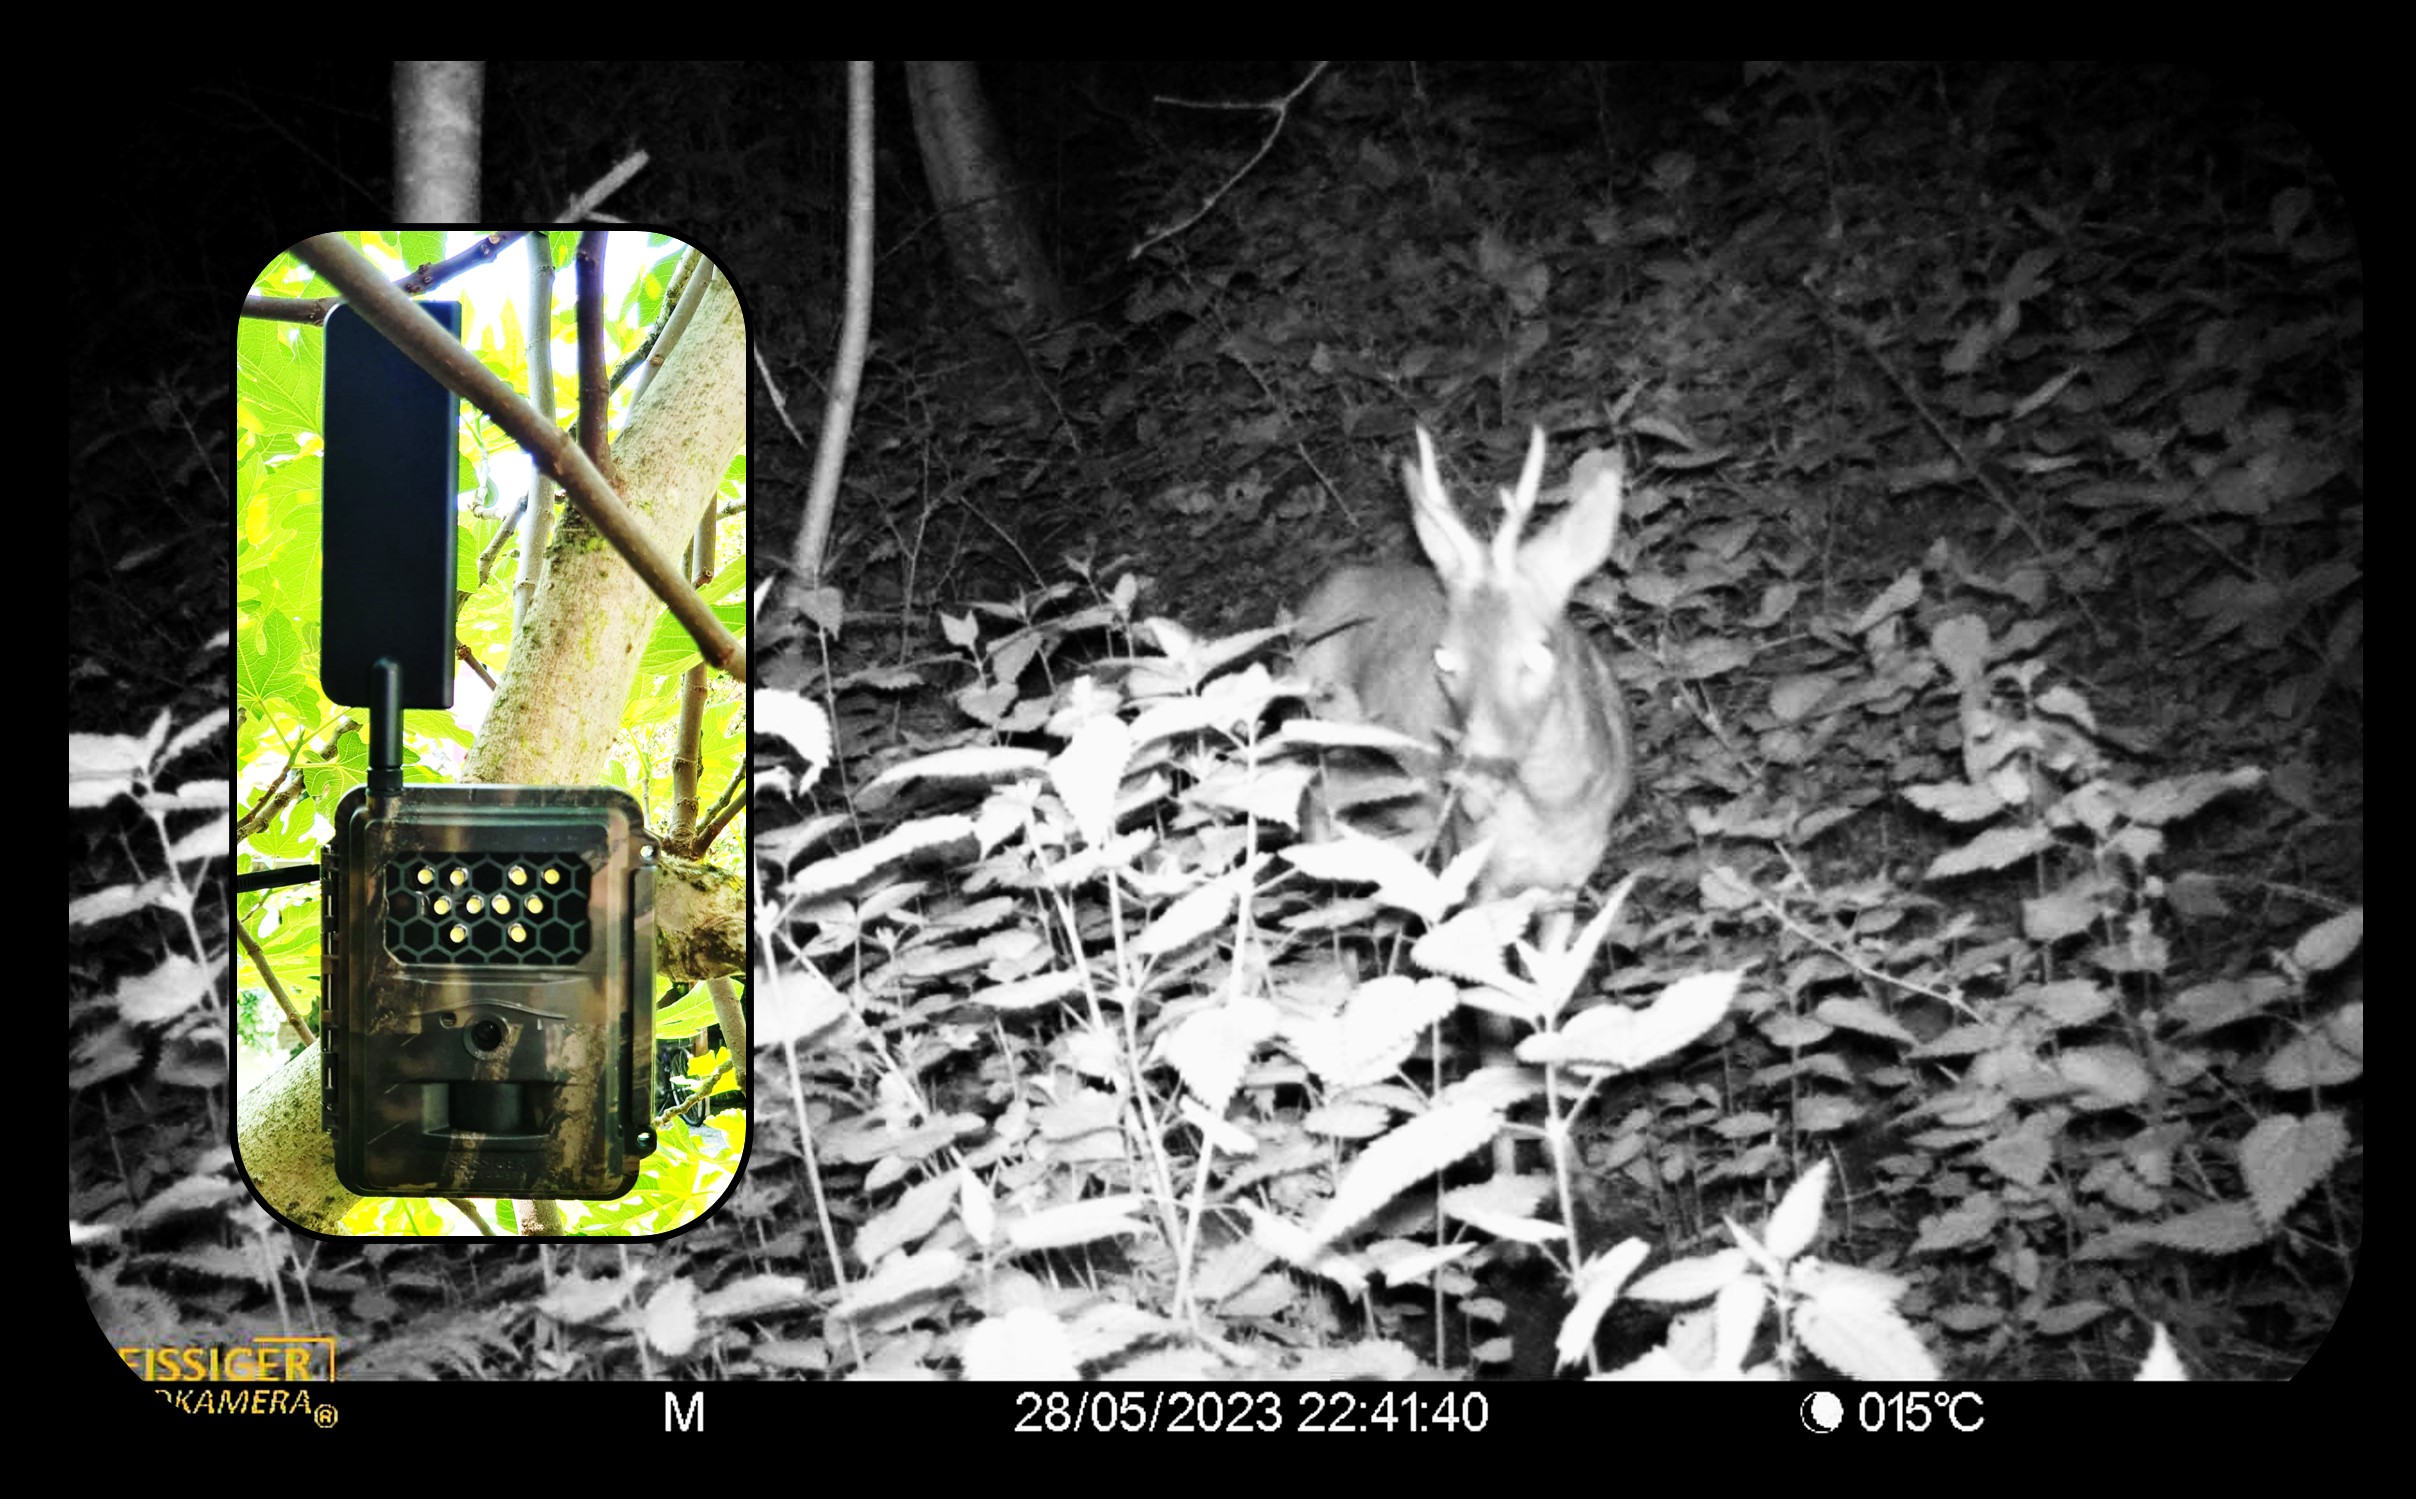
Fig. 1: Camera traps are a proven tool for monitoring wildlife abundance.

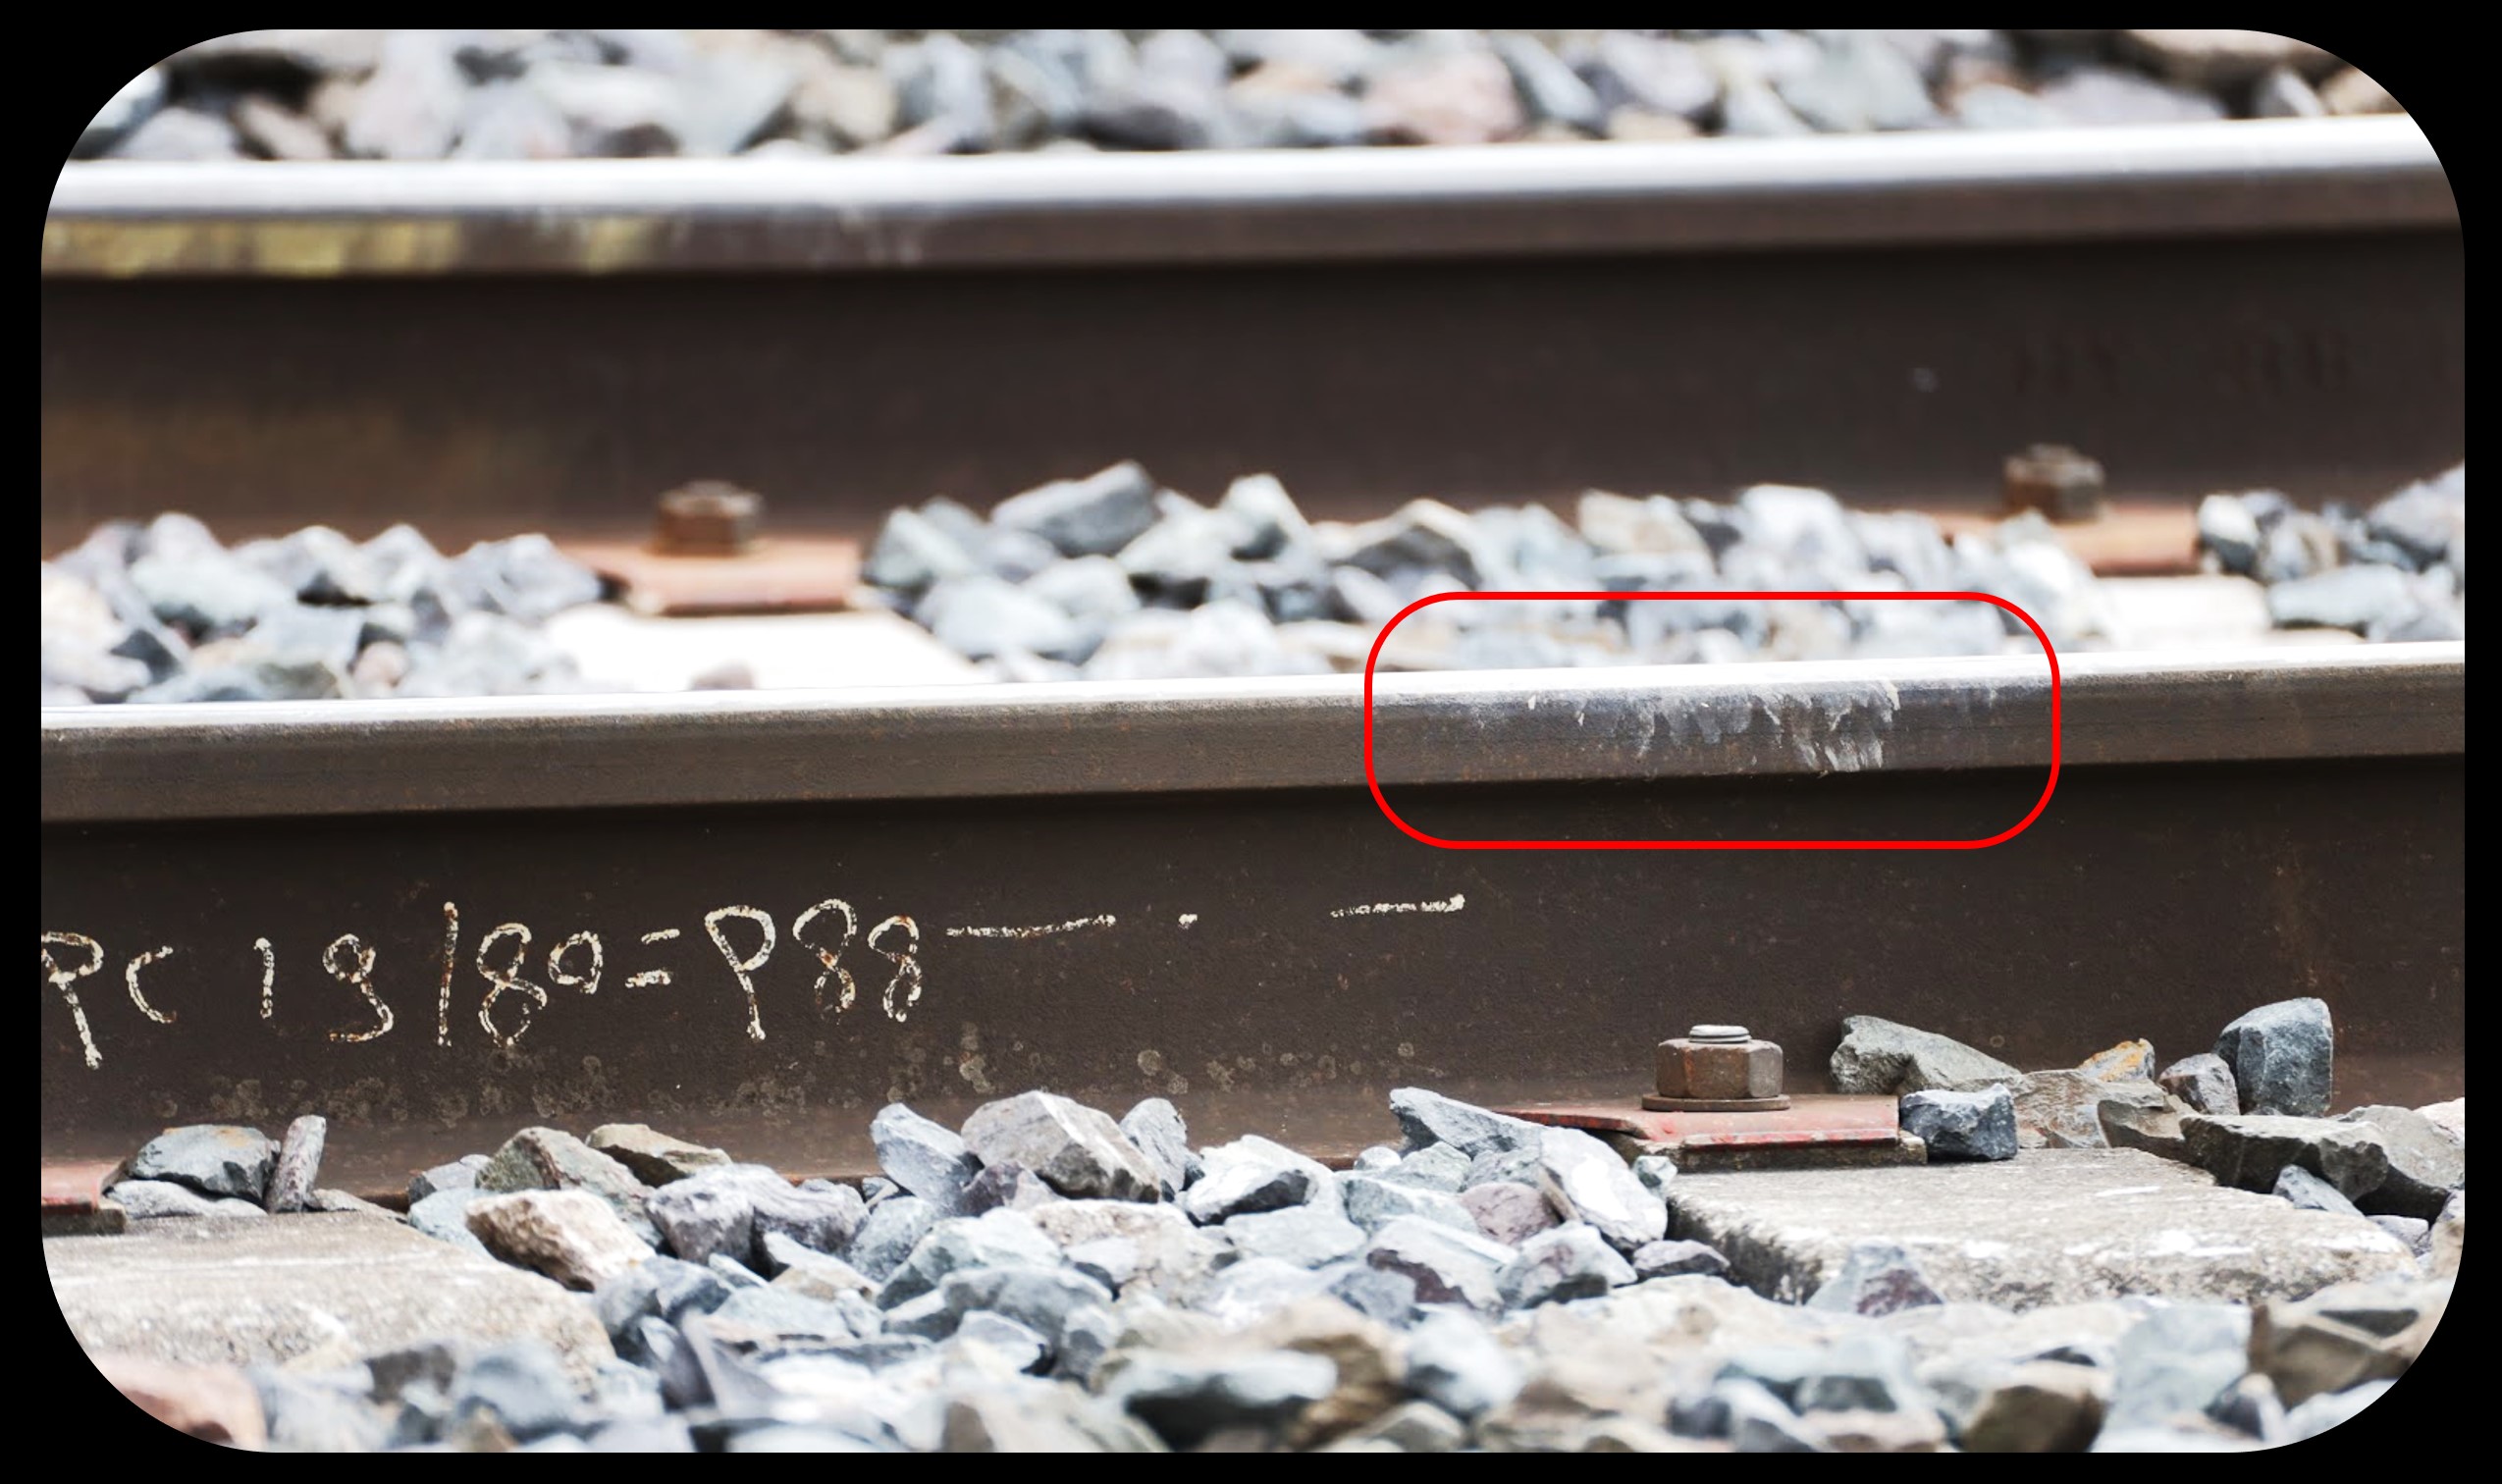
Fig. 2: Muddy sediments deposits serve as wildlife crossing indicators.

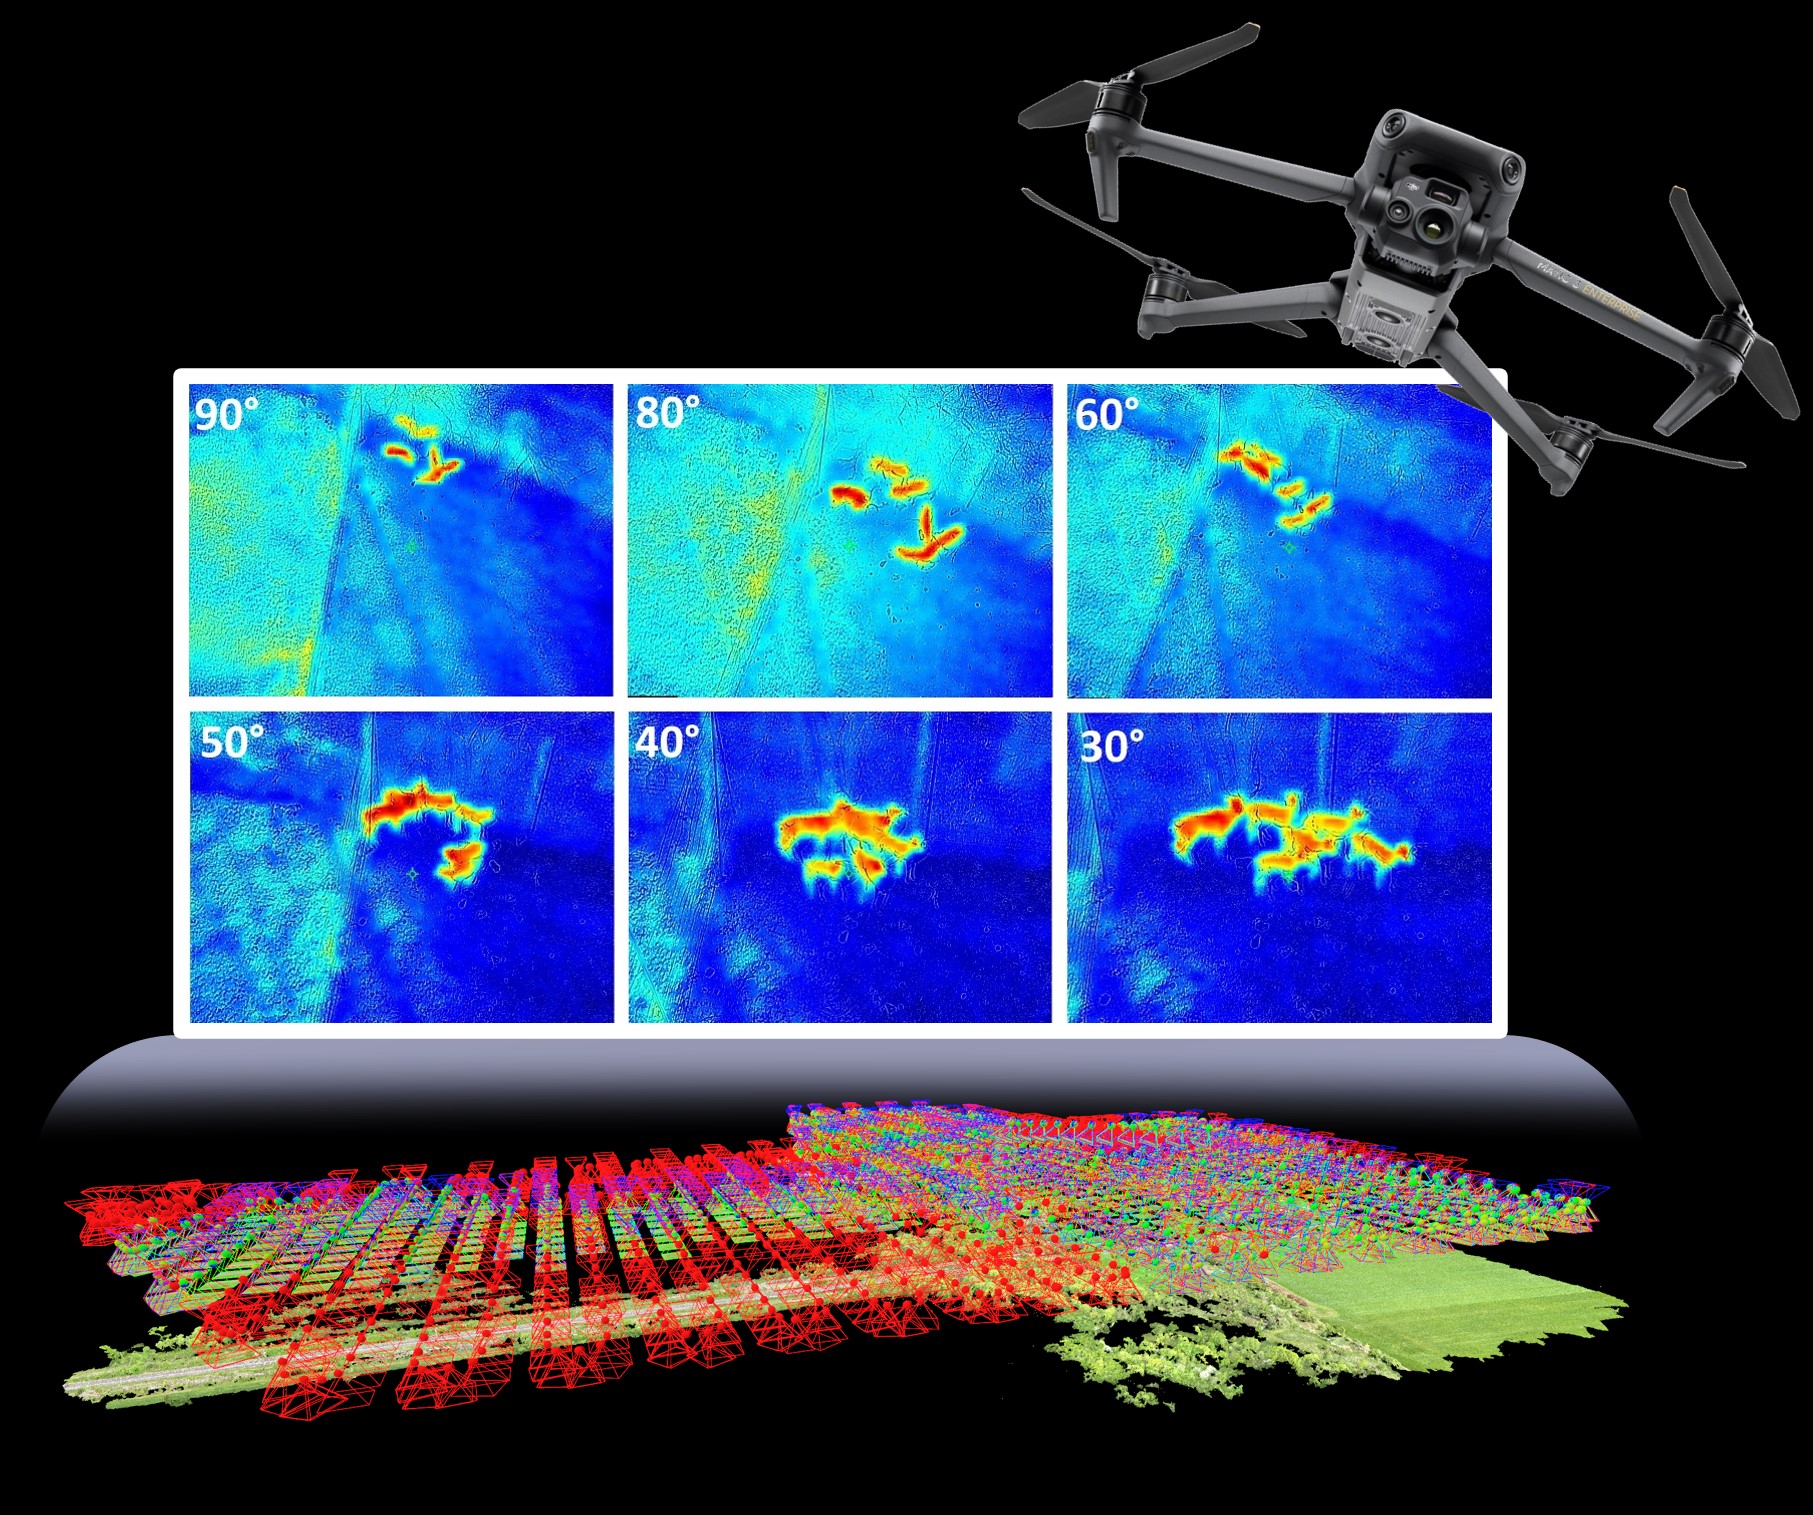
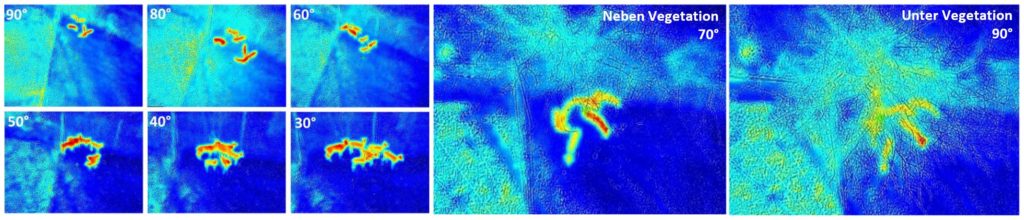
Fig. 3: Drone surveys enable terrain models to be collected in sensitive areas and wildlife to be observed directly using thermal imaging cameras.

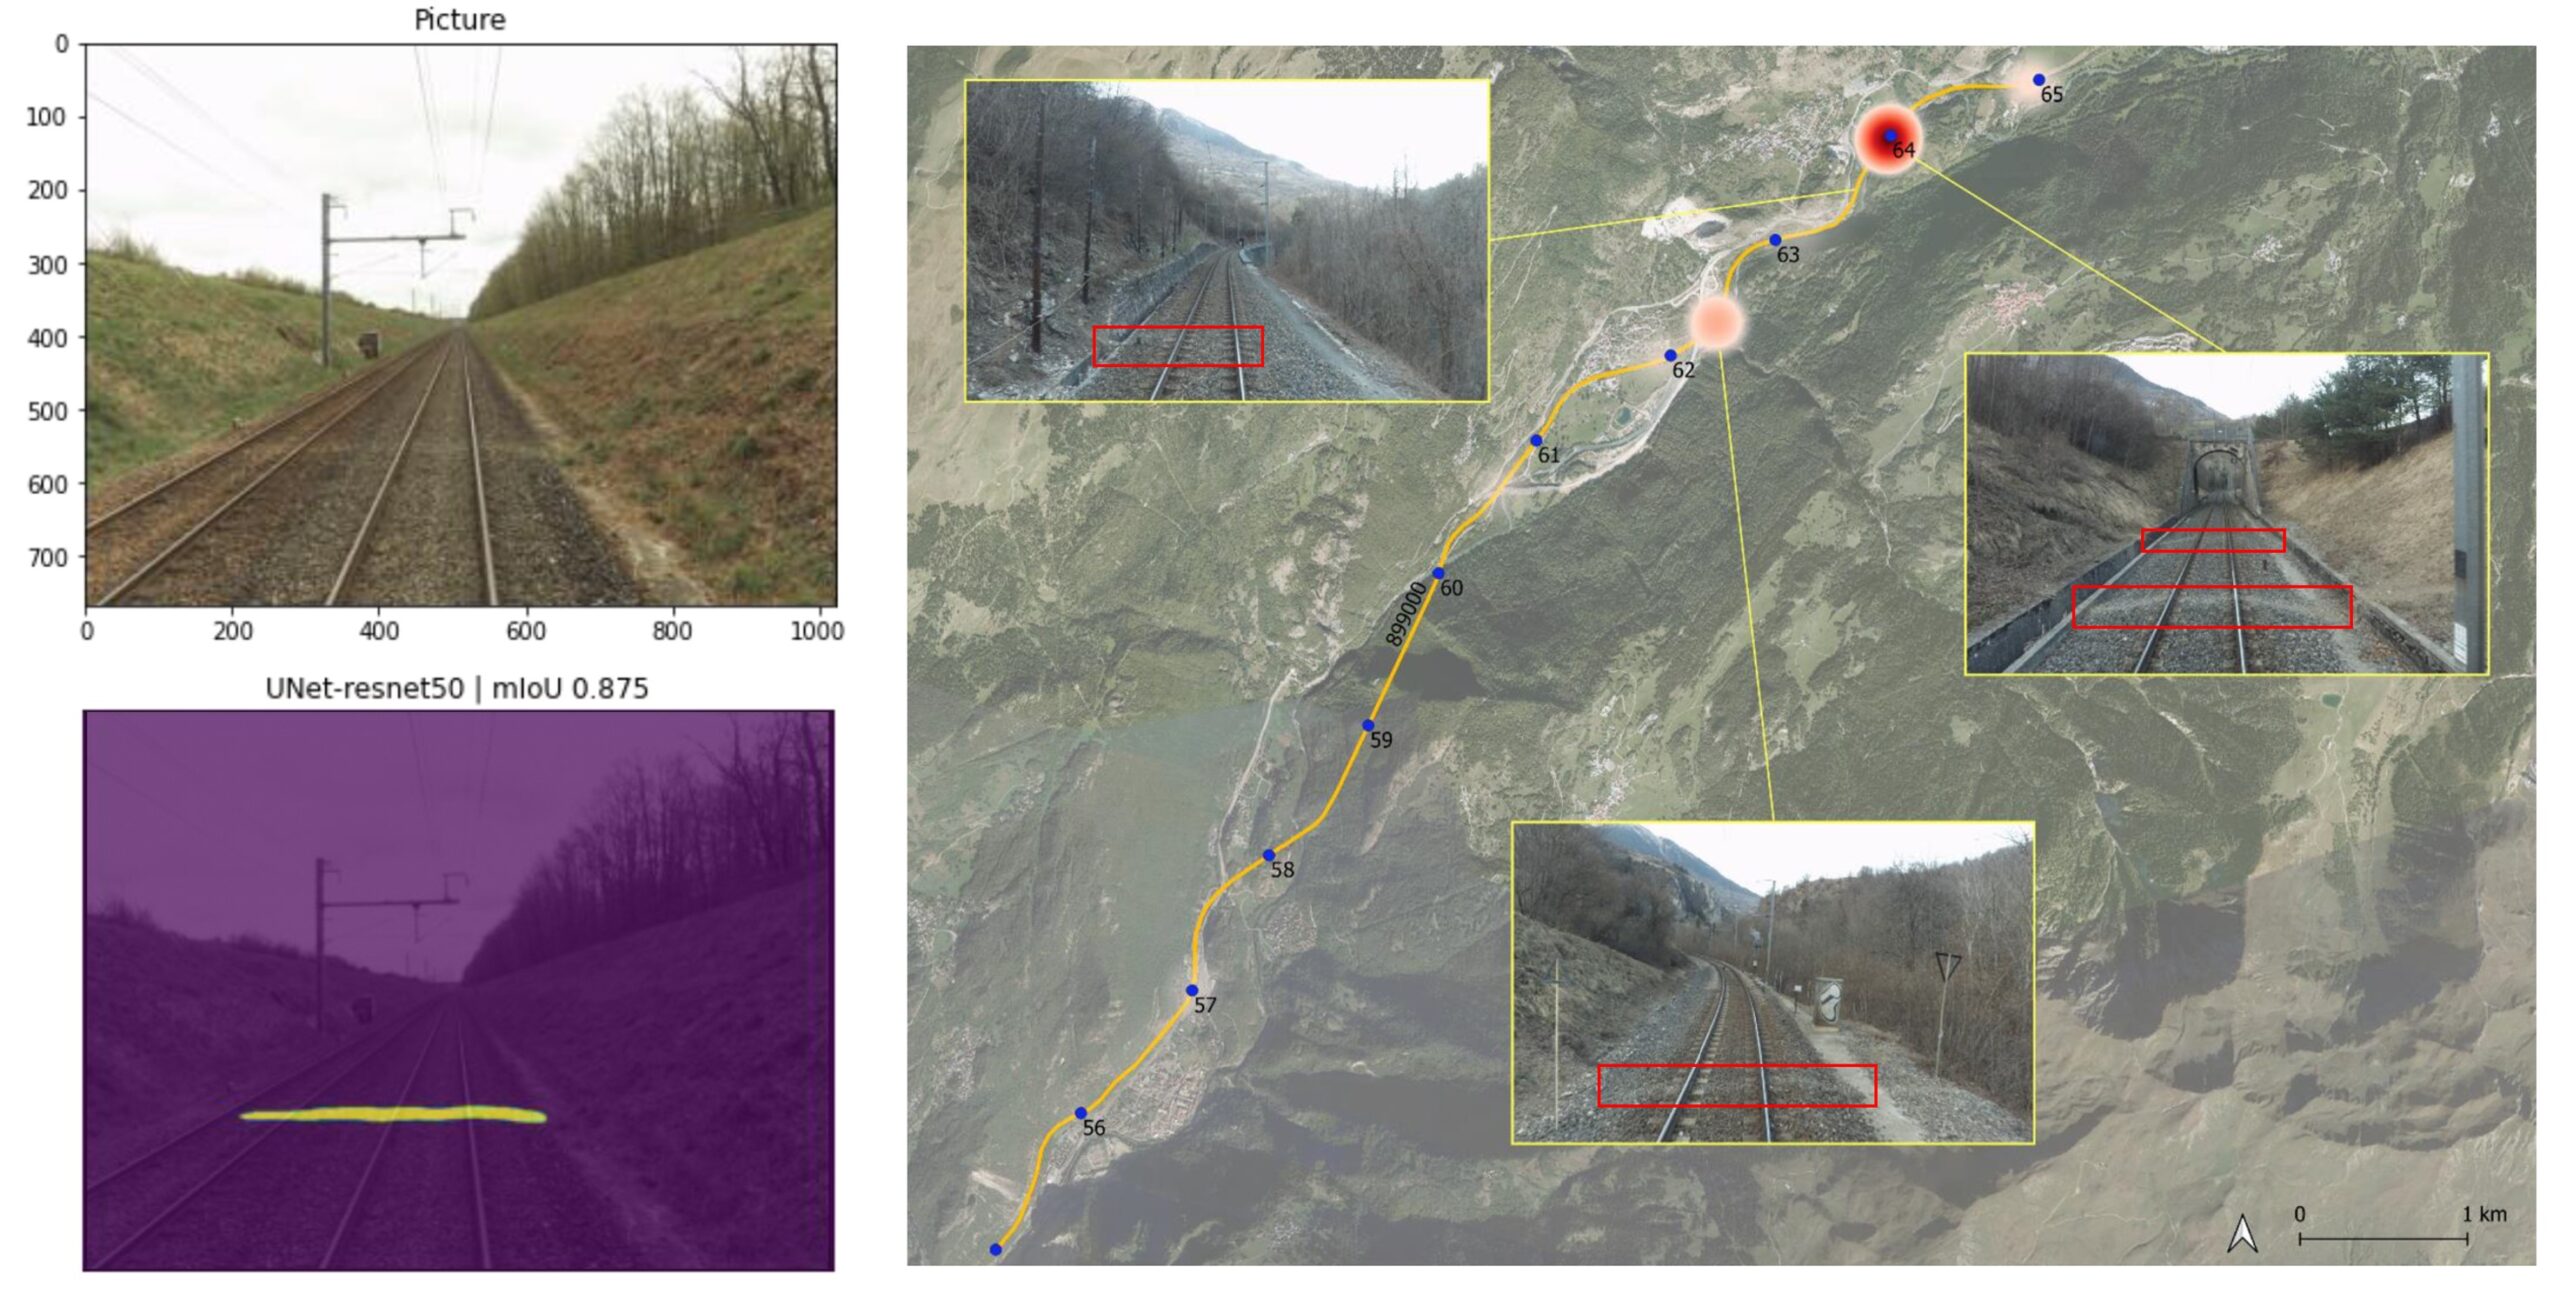
Fig. 4: Mobile Mapping images (Imajnet) can be used to identify wildlife crossings particularly frequented by gravel coloration.

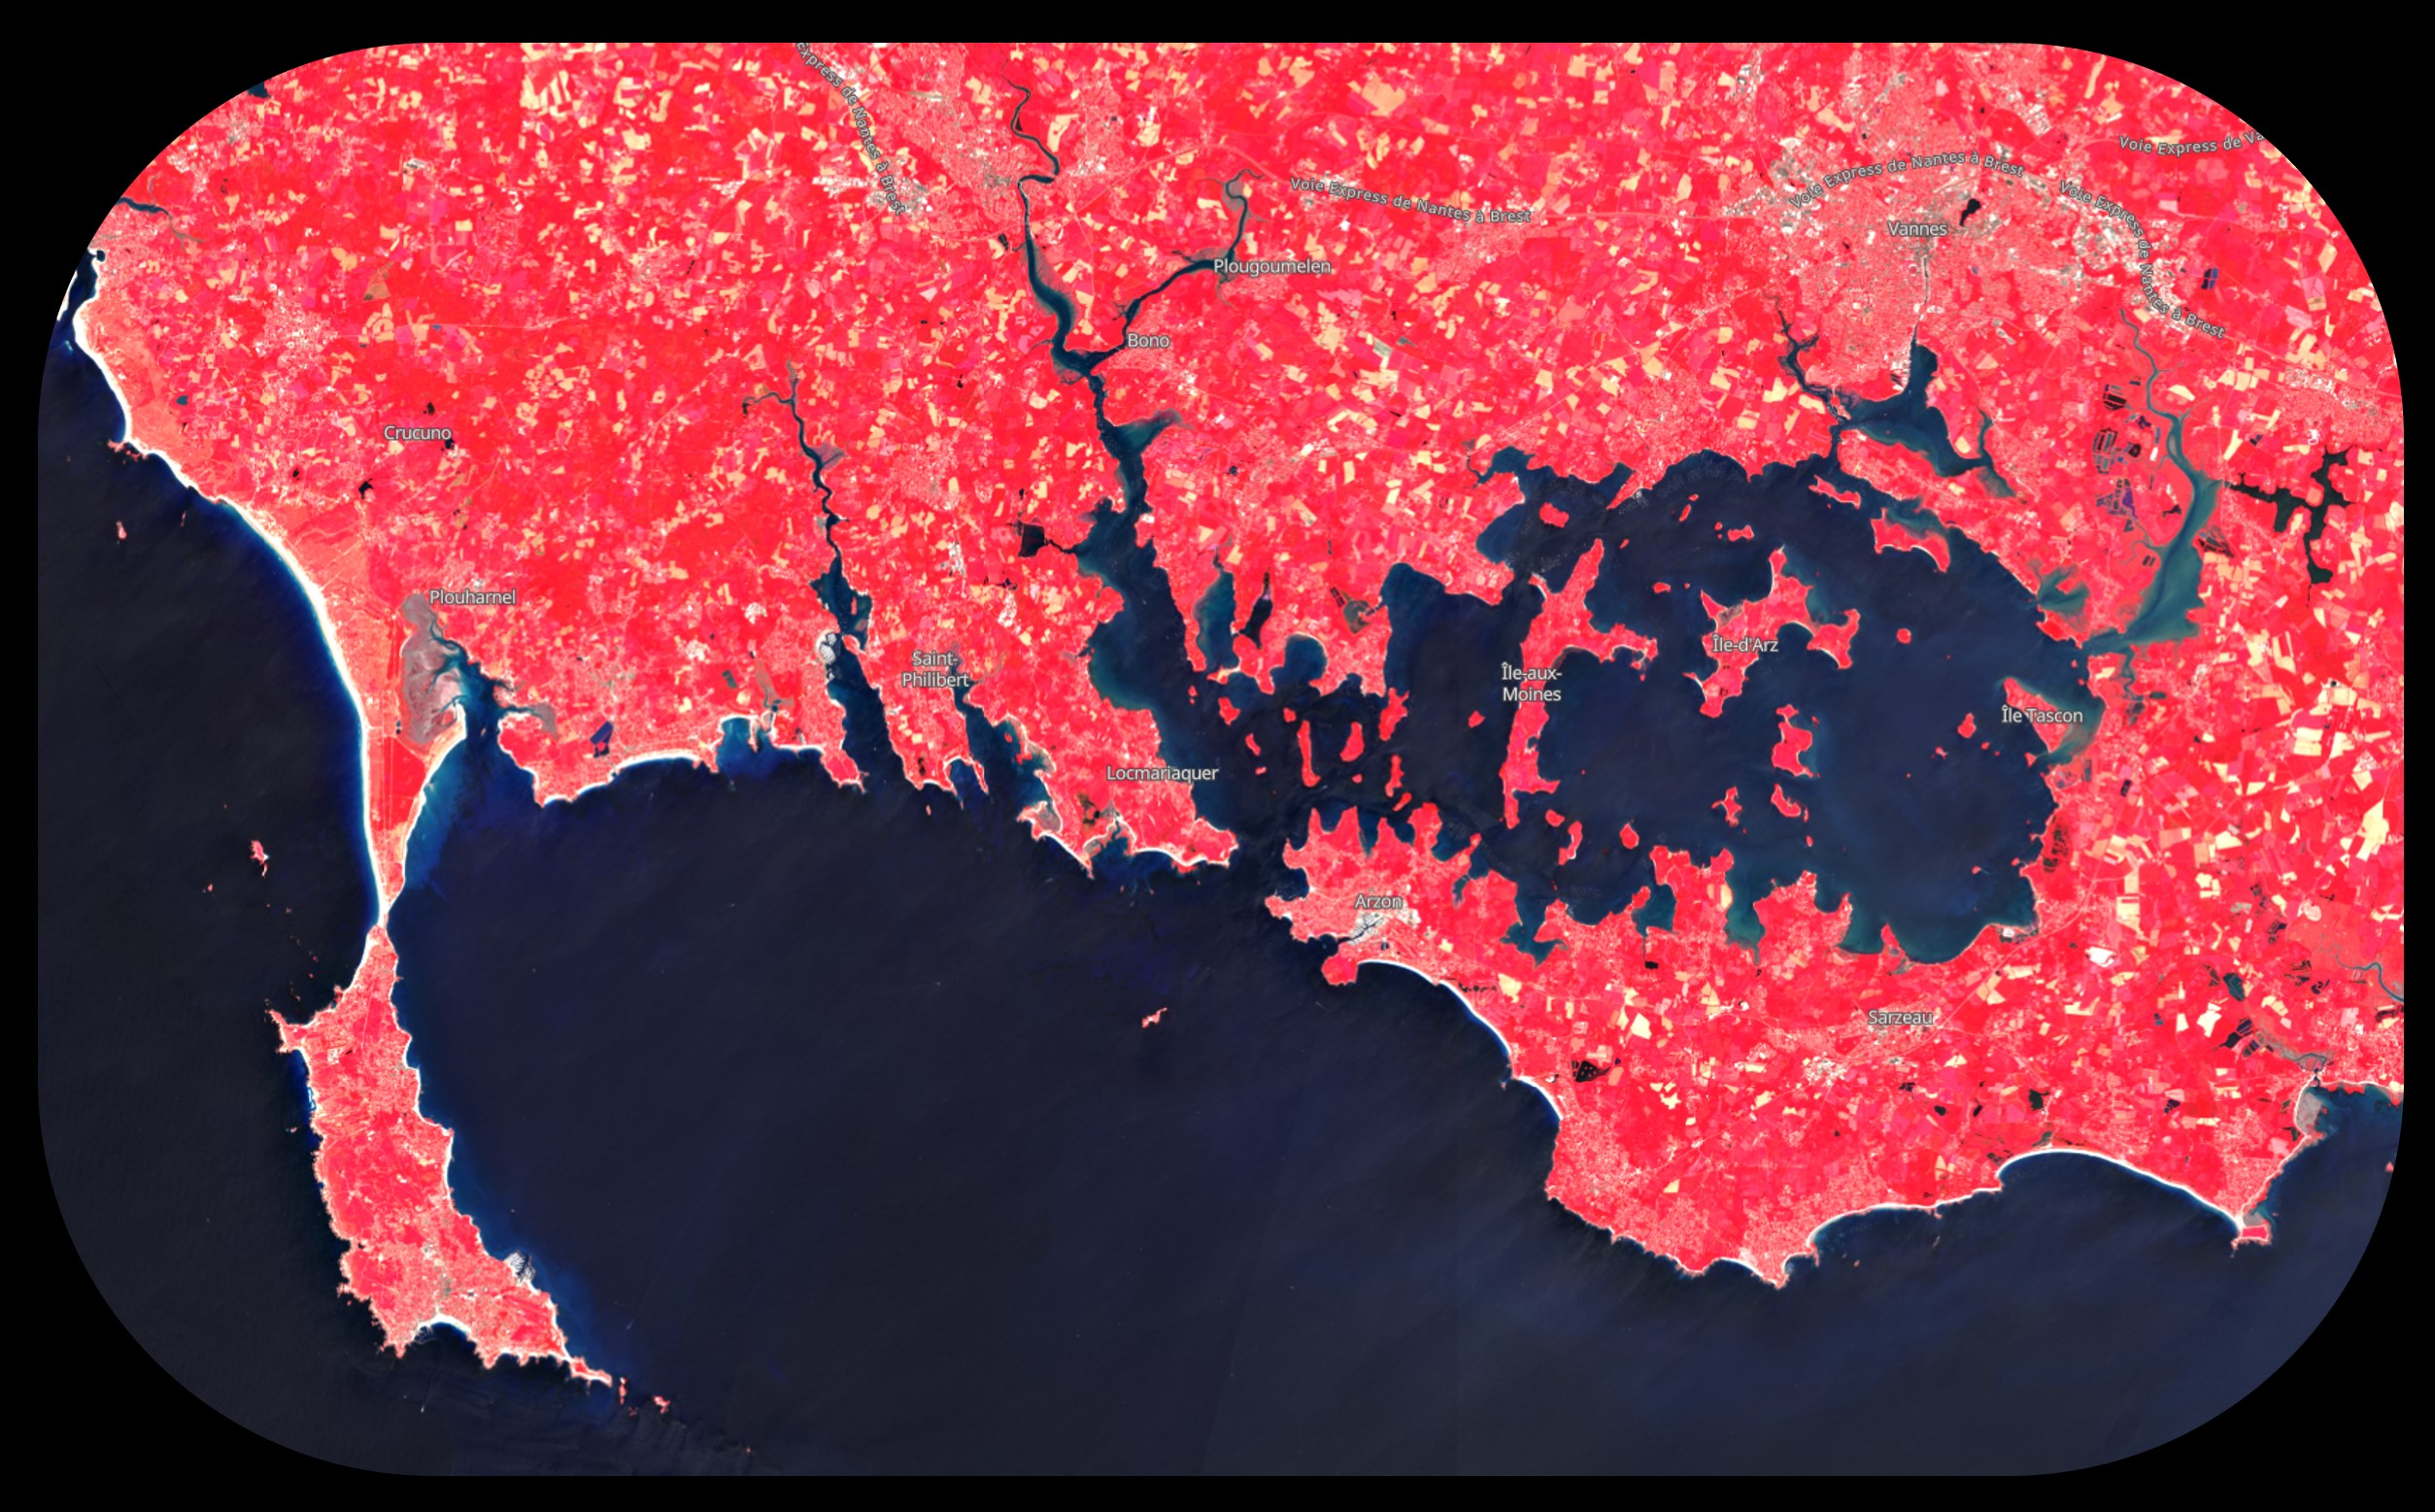
Fig. 5: The freely available high-resolution multispectral data from ESA’s Sentinel-2 satellite program provide an opportunity every six days to calculate a classifiable landscape model for the whole of France.

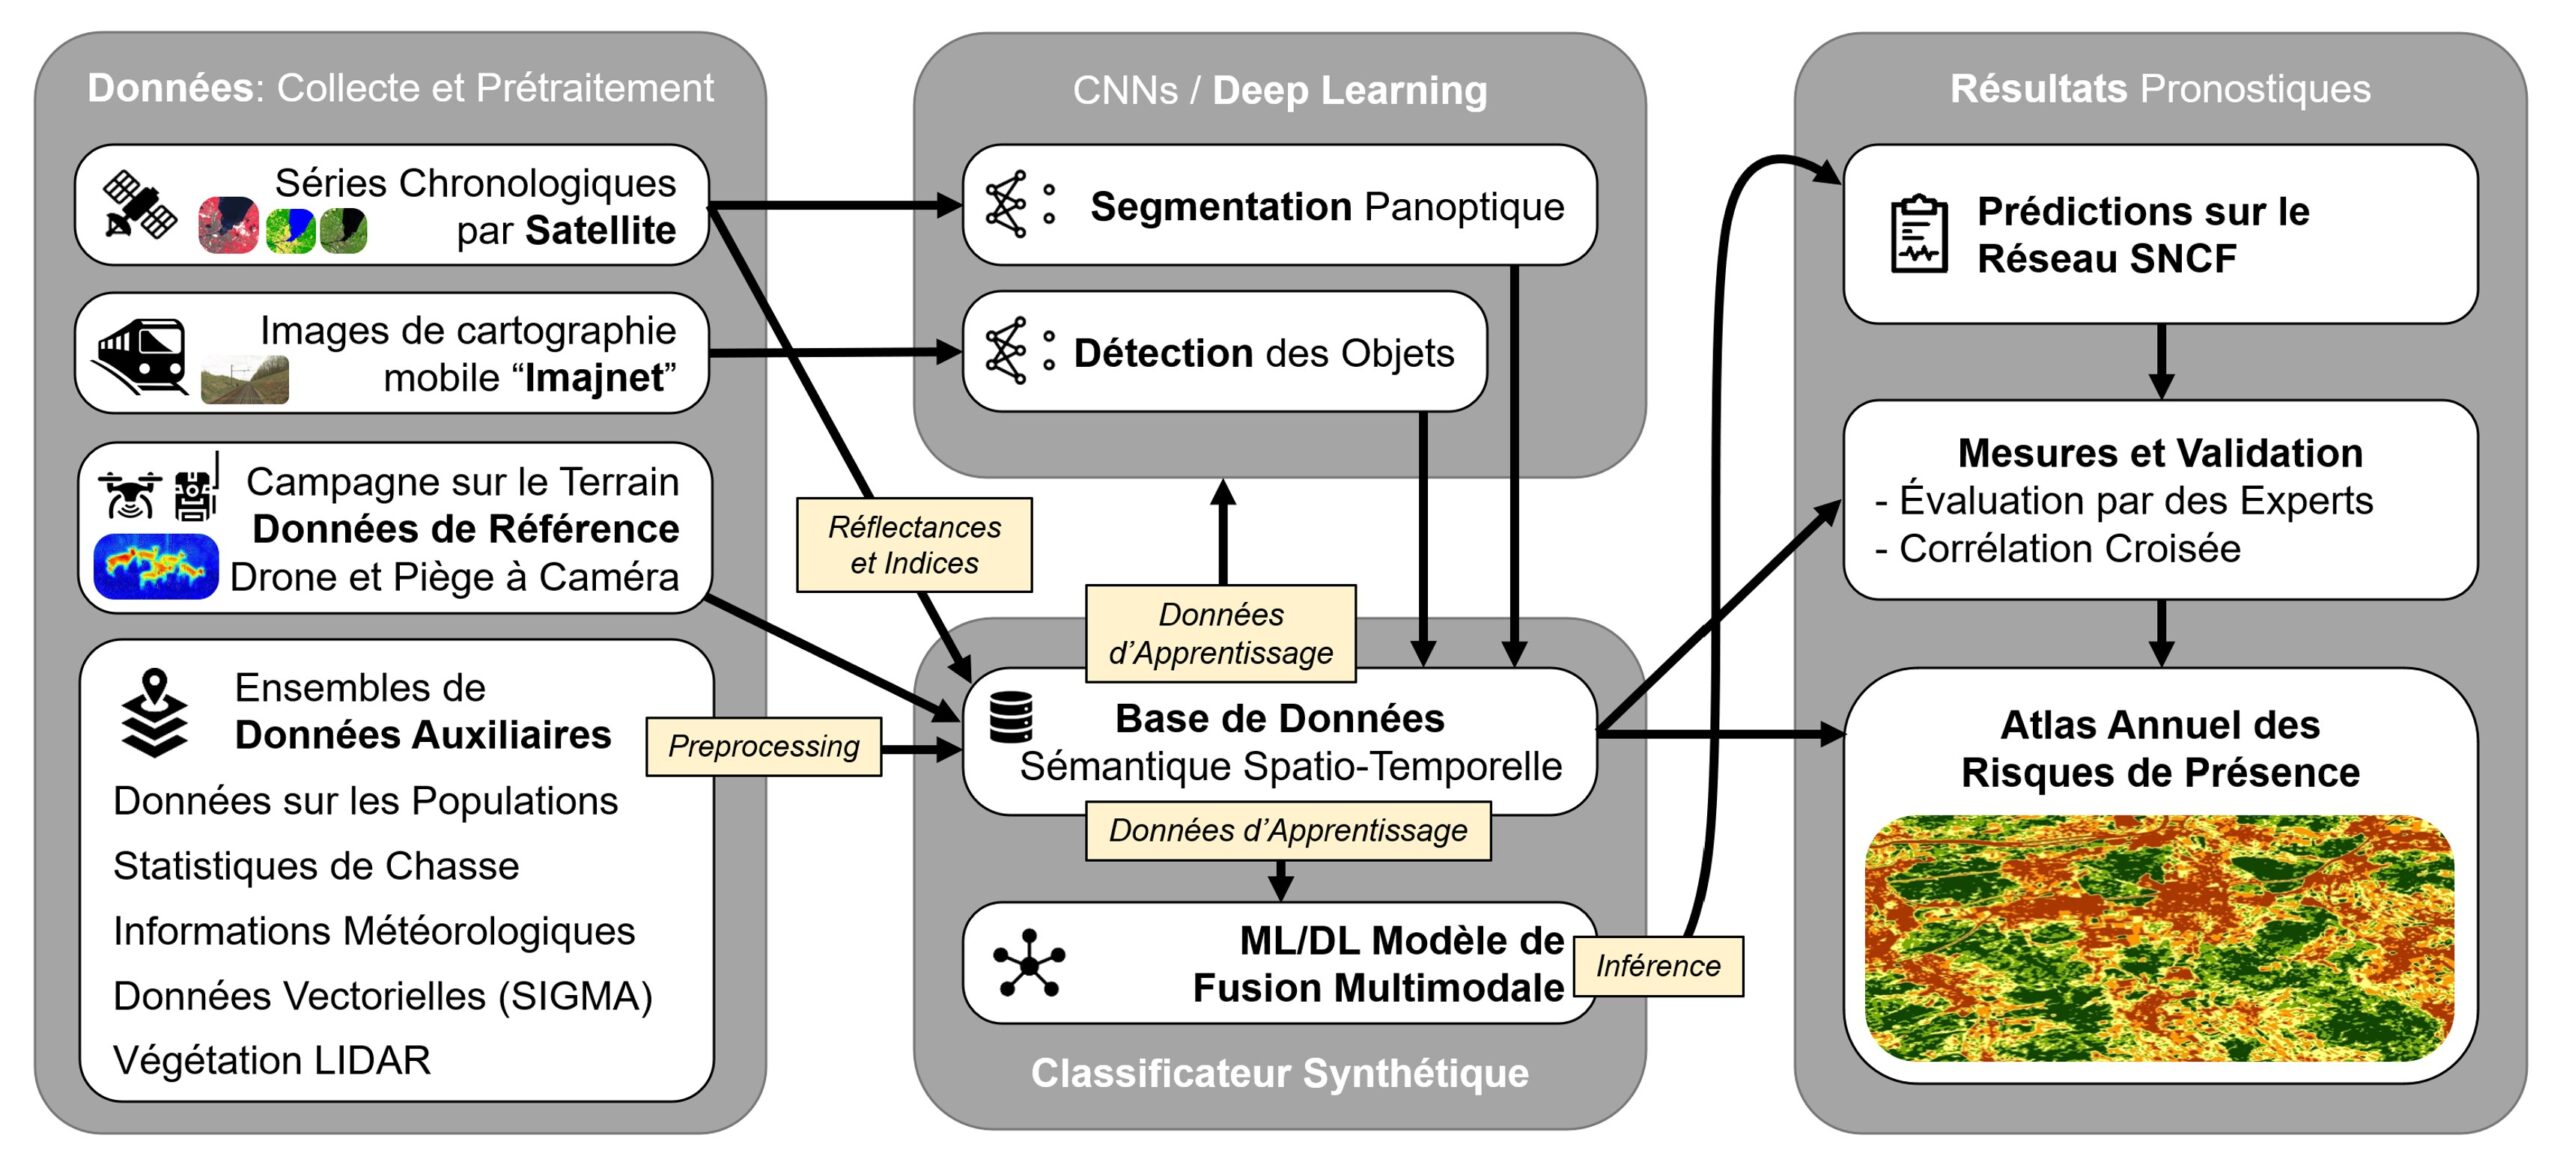
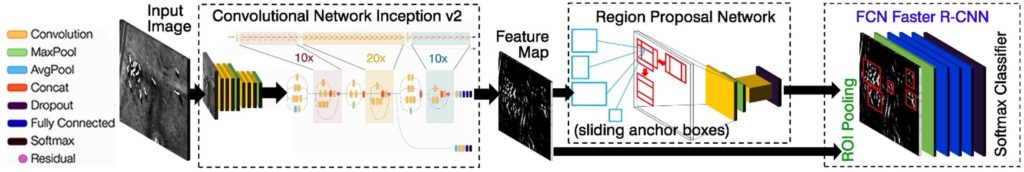
Fig. 6: Schematic overveiw of multimodal AI prototype (French version, status: June 2023)


Method

Our system accepts spatio-temporal data to generate risk forecasts over several time horizons (Fig. 6). Its robustness and high level of automation enable the production of a prototype for identifying critical incident points. Key steps include data compilation, pre-processing, selection of classification systems and evaluation of algorithmic approaches, with particular attention to ease of use and scalability.

To predict risk levels associated with wildlife accidents on the rail network, we couple automated classifications of terrestrial imagery (Fig. 4) and remote sensing (Fig. 5) with Machine Learning models. In the presence of fluctuating variance, convolutional neural network models – e.g. new architectures with short-term memory (CNN-LSTM) – outperform traditional regression models.

We will study early, late and hybrid fusion approaches to identify the most effective risk prediction model. Early fusion simplifies the training process by using a single model, but the results may lack interpretability. Late fusion provides modality-specific decisions and handles missing data well, but requires extensive feature engineering and multiple models. Hybrid fusion combines early and late fusion, delivering comprehensive results at the cost of increased complexity.

Expertise in the local rail network and animal habitats (Fig. 7) is essential to validate the accuracy of predictive results and the relevance of reference input data. We use mud marks on railroad tracks (Fig. 2) as indirect clues to wild boar crossing, validated by photographic traps (Fig. 1).

Drones equipped with infrared thermal imaging and zoom cameras (Fig. 3) are used to monitor wildlife behavior and population, either by counting animals in flight, or by analyzing images with computer vision neural networks.

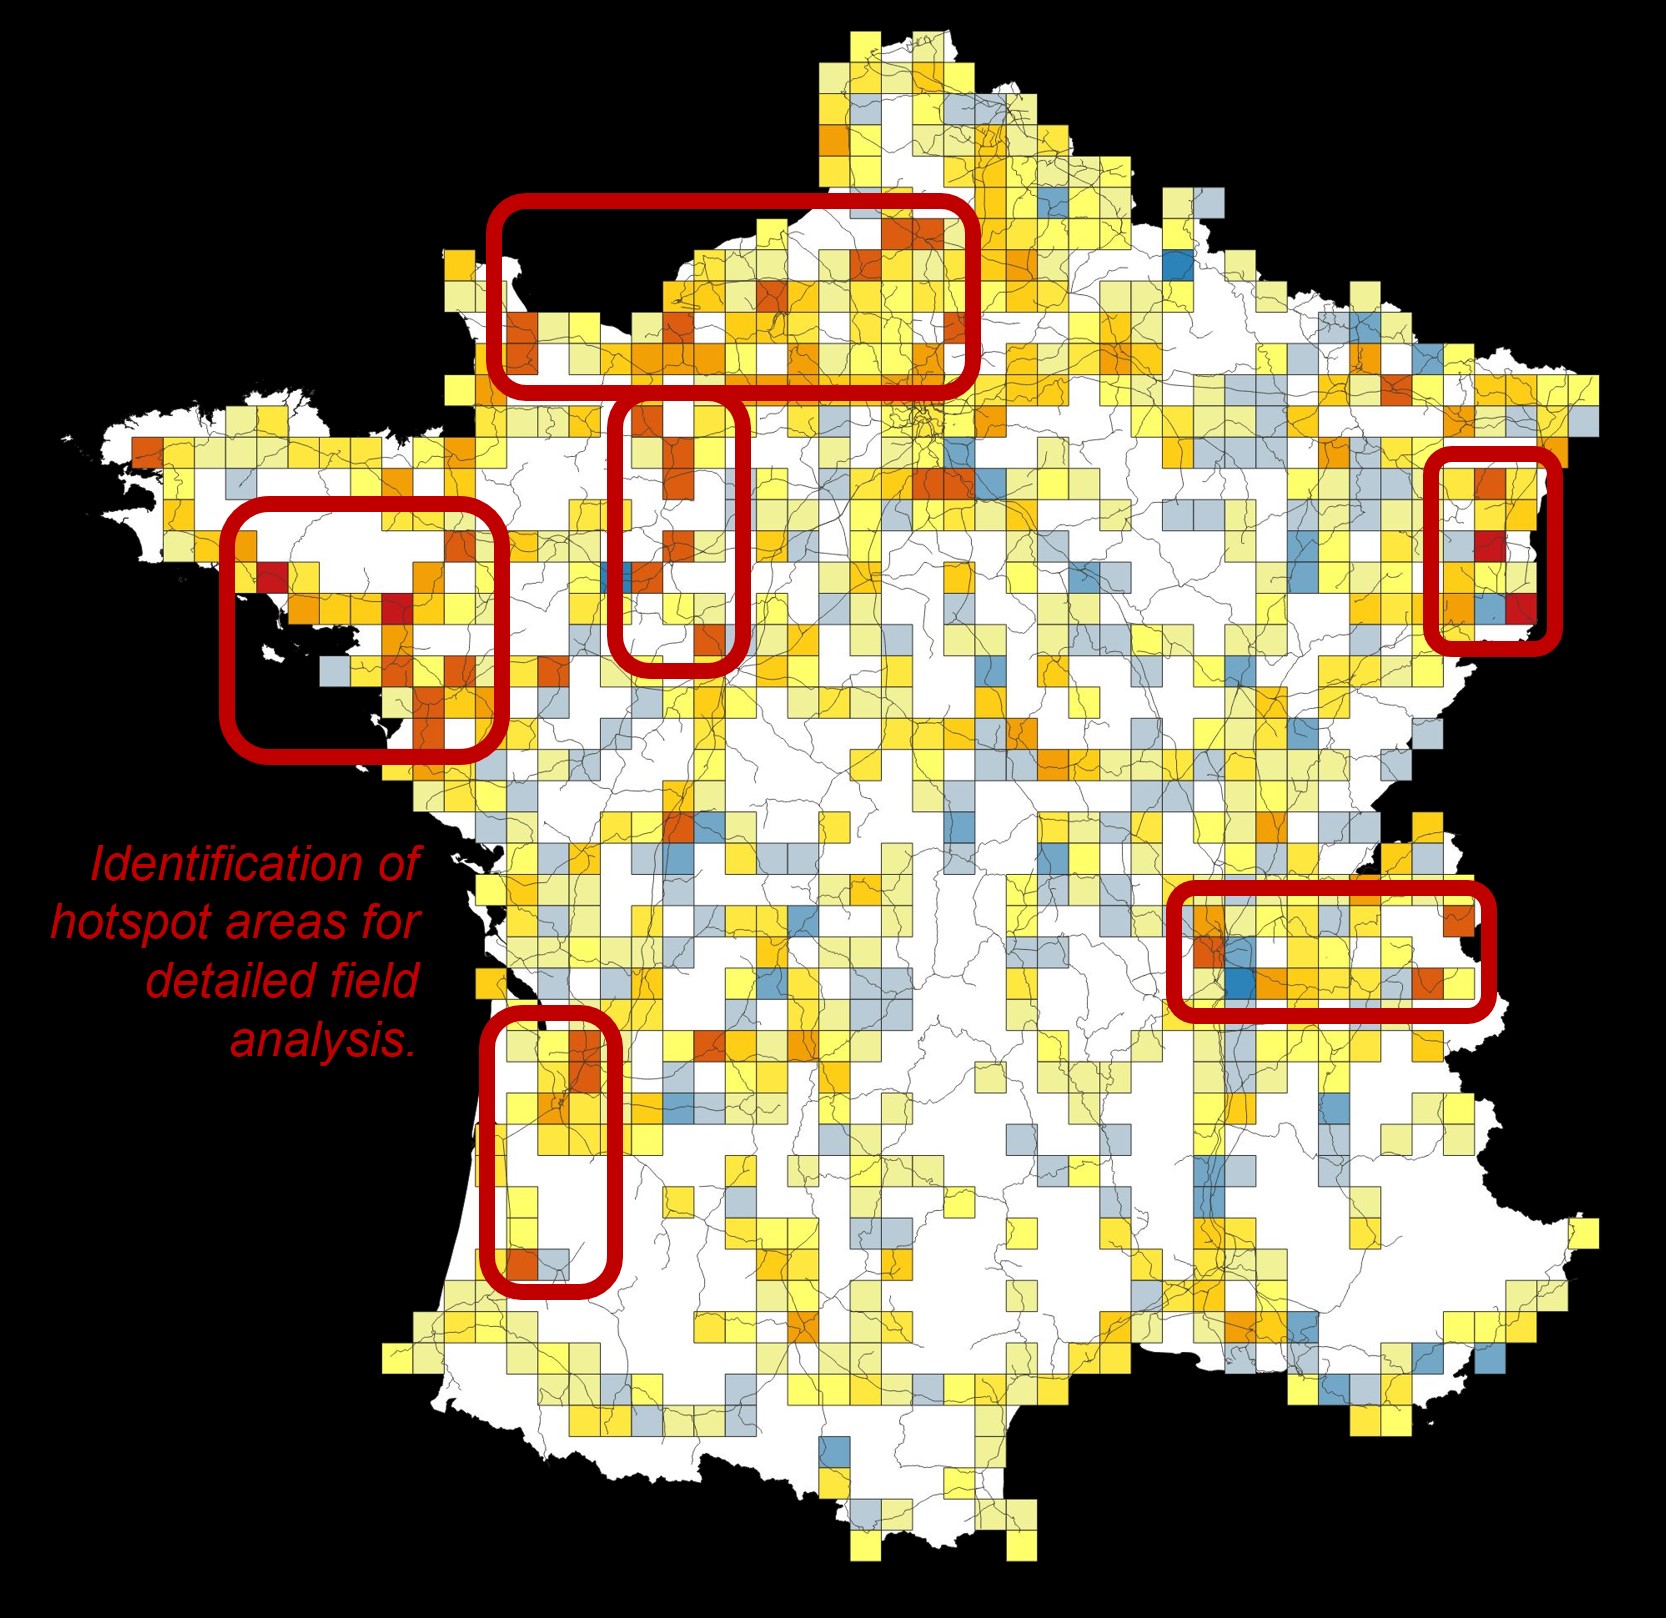
Fig. 7: Early prognostic heat map for the evolution of incident intensity forecast for 2024. Autoregressive integrated moving average (ARIMA) based on 2015-2023 incident data resampled to 20x20km resolution.

Color code: Blue – Fewer incidents expected; White – No change / No data; Yellow – More incidents expected; Red – Strong intensification expected.


Results

The project will provide robust, accurate and timely forecasts of the risk of accidents involving wild animals (particularly wild boar) on the French rail network. This information, derived from sophisticated machine learning models and multimodal data fusion, will enable SNCF to better understand the hotspots of incidents. This could lead to significant cost savings by reducing the number and severity of wildlife incidents, as well as improving operational efficiency.

By facilitating more informed decision-making, the system will help SNCF to better allocate resources for infrastructure construction projects, such as fencing and wildlife crossings. In addition, the model’s atlas of predictions can serve as an essential input for wildlife management strategies, helping SNCF to maintain a harmonious relationship with the surrounding environment.

In the future, this project could serve as a model for new target species or other frequently encountered environmental challenges. As the system matures and more data is collected, it will continually learn and refine its predictions, further increasing its value to SNCF.

AI Detection of Infrared Signatures

Short Video


Wildlife-Monitoring with UAVs – Artificial Intelligence for Automated Detection of Infrared Signatures

This translation is partially done automatically, please use the german version for reference.


Published in: 39th Scientific-Technical Annual Meeting of the DGPF in Vienna – Publications of the DGPF, Volume 28, 2019

Adrian F. Meyer, Natalie Lack, Denis Jordan 
[1] All authors: University of Applied Sciences Northwestern Switzerland, Institute Geomatics, Hofackerstr. 30, CH – 4132 Muttenz 

The detection of wild animals is a central monitoring instrument in ecology, hunting, forestry and agriculture. Previous methods are complex, often based only on indirect evidence and so often provide only a rough estimate of the stocks. The remote-sensing evaluation of UAV surveys over the Southern Black Forest and northwestern Switzerland carried out in this work showed that especially thermal imaging data are suitable for automation of wild animal detection. For this purpose, a modern method of artificial intelligence (Faster R-CNN) has been developed, which is able to extract by training properties characteristics of labeled animal signatures. For some species of animals (deer, goat, European bison, grazing livestock) extremely robust detection results could be achieved in the subsequent application (inferencing). The efficient implementation of the prototype allows real-time analysis of live video feeds under field conditions. With a detection rate of 92.8% per animal, or 88.6% in the classification according to species, it could be shown that the new technology has enormous potential for innovation in the future of wildlife monitoring.

1 Introduction

For areas of application such as population management, fawn rescue and game damage prevention in ecology, hunting, forestry and agriculture, it is of crucial importance to be able to carry out the most accurate collection of wild animal populations. In conventional monitoring methods are currently mostly used, each of which has significant disadvantages (Silveira et al., 2003): Counting campaigns with visual confirmation (searching for searchlights on forest roads) are enormously labor-intensive; Camera trap analyzes only cover a small part of the landscape; Hunting and wildlife statistics are associated with a strong bias; Tracking transmitters are very accurate, but also invasive and complex in their implementation.

The Institute of Geomatics (FHNW) has been cooperating since January 2018 with the Wildlife Foundation of the Aargau Hunting Association (Stiftung Wildtiere) to develop a method for wild animal detection using UAVs (Unmanned Aerial Vehicles). It will be analyzed how far automated remote sensing offers advantages over conventional monitoring by saving time or human resources and making surveys more accurate and complete (Gonzalez et al., 2016). Central questions which this study should answer are the choice of sensors and carrier systems, the general visibility of animal signatures on infrared aerial images (eg the robustness against shadows in the mixed forest), and the structure of a high – performance algorithm for the automated detection and classification of the Wildlife individuals. One result of this analysis is a prototype designed to enable automated animal detection on aerial image data.

2 Method

2.1 Data collection

In the spring of 2018, 27 aerial surveys were conducted on seven natural game enclosures with native species in northwestern Switzerland and the southern Black Forest. For each enclosure, approximately 500 RGB images, 500 NIR multispectral images and 5000 TIR thermal images (radiometric thermograms) were generated using the senseFly Albris multicopter or the fixed-wing UAV senseFly eBee to facilitate a technology comparison (see Fig. 1). The recording time (February / March) was chosen so that the heat contrast between carcass and mostly wooded environment would be as high as possible. At the same time, the foliage-free vegetation should minimize shading.

Fig. 1: Left: Used senseFly aircraft “eBee” (above) and “Albris” (below). Right: Typical trajectory with the eBee (blue) over an animal park (green) with the trigger positions for aerial photos (white). (Visualizations: Gillins et al., 2018; Google 2018; senseFly 2018)

With the Fixed Wing large areas can be easily detected with interchangeable sensors (RGB, NIR, TIR), including a high resolution thermal camera ( ThermoMap, 640x512Px, max 22ha at 15cm / Px GSD and 100m AGL). Although the Multicopter can fly much more flexibly and more deeply due to its hoverability, the permanently installed thermal camera has a much lower resolution (80x60Px). The loud rotor noise with a low trajectory also represents a much stronger interference with animal behavior compared to the fixed wing.

2.2 Pre-Processing

The very high resolution RGB and NIR images (~ 3cm / Px GSD) are well-suited for orthophotomosaic mapping, but often lack sufficient contrast for the visual recognition of animal signatures under foliage-free vegetation. In the further course of the study, this could also be verified by terrestrial hyperspectral reference measurements (λ: 350-1000 nm) on forest soil, vegetation and animal carcasses.

The thermograms, on the other hand, show high-contrast signatures of individual wild animals (Fig. 2). At the same time, the images are hardly suitable for photogrammetric bundle block balancing, as the animals usually move too much between two shots. In the relevant image areas, this does not result in sufficient overlay fidelity, so that processed TIR orthophotomosaics of contiguous habitats often contain no visible signatures. Therefore, for automated analysis, the thermograms were either processed directly as non-oriented raw data or individually orthorectified by DSM projection.

3 Analysis

3.1 Shape of the Thermal Animal Signatures

Visible changes in the appearance of the signatures were first examined systematically by varying the reference parameters. Thus, a shallower recording perspective supports animal identification by a human observer (Figure 2, left): features such as head-torso ratio or extremities are more prominent. The delimitation of the individuals from each other, however, is supported by a steeper perspective.

Although dense branches may reduce the contrast of the signature due to convection heat distribution and shielding in mixed forest that is as foliage-free as possible. However, the form, scope and basic visibility of the signatures are largely retained (Fig. 2, right).

Fig. 2: Thermograms with the signatures of a fallow deer pack (six animals, blue 4°C, red 10°C). Left: Comparing signatures from six different angles.
Middle / Right: Signatures next to and below a foliage-free ash in comparison.

3.2 Strategies for Automated Signature Detection

Several strategies for the automated detection of signatures were implemented iteratively and checked for their classification accuracy and applicability. The classic remote-sensing approach of classifying thermograms into, for example, Erda’s Imagine Objective using object-based image analysis was rejected. Due to the variety of the signatures, this method could not find a feature-describing set of variables that would reach a detection precision of over 41%.Convolutional Neural Networks (CNN), on the other hand, have demonstrated exceptional robustness in image classification through automatic feature extraction in recent years (Szegedy et al., 2016). Sections 3.3 and 3.4 describe two CNN approaches that achieve precise animal detection in different ways.

3.3 Raster Segment Classification with dichotomous CNN

A dichotomous (“two-way decision”) CNN with a depth of 7 neuron layers
(Figure 3 center) was built with Keras and Tensorflow under Python 3.6 . It classifies raster segments of orthorectified thermograms by inferencing into the classes “animal” and “non-animal”. The input layer is a 64x64Px matrix, which corresponds to the maximum possible GSD geoprocessed 5x5m segments (Figure 3 links). After about 3 hours of training on desktophardware, a high degree of classification accuracy of approx. 90% can be achieved for a specific aerial survey (Fig. 3, right). The pre-processing of the thermal data (3D projection on DSM, orthophoto generation, geoprocessing), however, is very time-consuming and computationally intensive and thus can be classified under field conditions as impractical to automate. In the case of time-critical applications such as fawn rescue, classification results must, at best, already be available during the flight. Inferencing to live raw data would not be subject to these limitations. Due to the raw data resolution of 640x512Px, this approach provides the UAV operator
However, due to the 64x64Px input resolution, only a coarse 10 × 8 detection grid was used in the practical application.

Fig. 3: Left: Approx. 10’000 5x5m footprints as input tiles, generated from 45 orthorectified thermograms. Middle: Scheme of the dichotomous neural network, neuronal layers in the purple marker. Right: Classification – 71 tiles Green: “Animal”; Rest Red: “non-animal”.

3.4 Object recognition by means of R-CNN

For live raw data interpretation, Faster Region-based Convolutional Neural Networks (Faster R-CNN) are better suited. Models of this class can classify objects on higher-resolution overall images by locating regions of interest (RoI) through iterative region proposals . Also, different classes can be trained and recognized at the same time.

An Inception v2 network is used (see Fig. 4), which mimics the structure of the pyramidal cells in the visual cortex of vertebrates with a depth of 42 neuron layers. By pre-training with 100’000 everyday images (so-called COCO dataset ), the edge weights between the neuron layers in the specific training can be adapted faster and more efficiently to new goals for setting the bounding boxes . Even with partially limited hardware requirements, the model is still considered fast and precise (Szegedy et al., 2016).

The implementation was carried out using the Tensorflow Object Detection Library with the support of the Nvidia CUDA / cuDNN deep learning framework to parallelize the GPU shader cores. For the training, a test dataset of approx. 600 thermal images with approx. 8’000 animal signatures was manually marked by drawing approx. 1’800 bounding boxes. After about 12 hours of training (about 100’000 steps), the approx. 50 Mbyte Frozen Inference Graph was exported. A high-performance Python-based prototype applies this knowledge scheme to new thermal data via inferencing.

Fig. 4: Schematic structure of the constructed R-CNN (subschema “Inception v2” from Alemi, 2016)

4 Results

In comparison, object recognition using R-CNN proved to be the superior approach because of the ability to use raw data and train multiple classes simultaneously. This architecture was therefore used in the prototype implementation.

If the network is only trained for the general detection of animals (Fig. 5-A), then inferencing achieves an enormously high detection rate of 92.8% per animal. The analyzes are also relatively robust in the general detection compared to quality losses in the input data (eg motion blur and shadows), as the animal signatures are usually recognized correctly in at least one frame and can be used for the detection.

Fig. 5: Evaluation of the detection results on video feeds simulating a live overflight. Left: Table of count statistics (* Class of fallow deer – Damwild – contains fallow deer, sika deer and Axis deer).The proportion of false-negative detections is not listed because it corresponds to the reciprocal of the detectability. Right: Examples by inference of calculated bounding boxes.

Precision is slightly lower in the animal species classification (Figure 5-BCD), but far exceeds the success rates of conventional detection methods for the fallow deer , red deer and goat species . European bison and Scottish highland cattle also achieve very high precision (detectability> 90% per animal,> 80% per frame with n≈150 trained bounding boxes).However, these values ​​are not comparable with those of wild animals in semi-natural mixed-forest enclosures, since only data in open pasture landscape was available for both training and inferencing (see pasture in Fig. 5-A, mixed forest in Fig. 5 BCD). The wild boarshumans and smaller mammals classes did not achieve sufficient classification precision due to a low number of training data (n <60).

5 Discussion and Outlook

Combining UAV-based infrared thermography with state-of-the-art deep learning techniques indicates the potential to increase efficiency and quality in population estimation. The current standard – a laborious, labor-intensive process of searching for headlights, in which many kilometers of forest roads are traversed to map only a small, unknown proportion of animals – could be complemented with modern methods of pattern recognition. The implemented prototype achieves an inferencing performance of about 8 FPS on mobile hardware (2016 consumer-grade laptop). This makes the system so efficient that it can be applied to a live live video feed during the flight. These promising results thus show that a replacement of the classical methods of detection for certain areas in the future is conceivable.

Another important application is the fawn recovery. Fawns hiding in meadows often fall victim to combine harvesters due to their pushing reflex. If thermal UAVs are used today, however, the process is still largely manual. In addition, the training of pilots for signature recognition is complex. The presented software automation can make UAV-based fawn rescue much more available in the future.

When it comes to game damage prevention, the focus is usually on wild boar rots, which invisibly haunt a retreat in arable crops from the outside. The location of the animals is possible with this technology even before the emergence of a major damage. Both for the game damage prevention, as well as for the Rehkitzrettung it requires for operational use additional training data. Once these have been surveyed and marked, the existing deep learning network can be further trained by means of fine tuning and built on the knowledge already acquired.

Due to the rapid progress in UAV technology, it is quite conceivable that smaller multicopters will soon be able to fly quieter and thus cause less disruption of animal behavior. With lower altitudes and stronger sensors, these would be able to generate even better thermograms, which in turn facilitates signature classification for the neural network. It would be conceivable to identify further individual characteristics of the species already analyzed, such as age and gender, or to extend the analysis to smaller species such as badgers, hares and foxes, as well as rare species such as lynxes and wolves.

6 Bibliography

Alemi, A., 2016: Improving Inception and Image Classification in Tensorflow. Google AI Blog.

Google, 2018: Google Earth Pro 7.3.1, Aerial Texture: GeoBasis-DF / BKG, 2017-08-07.

Gonzalez, L., Montes, G., Puig, E., Johnson, S., Mengersen, K., Gaston, K., 2016: Unmanned Aerial Vehicles (UAVs) and Artificial Intelligence Revolutionizing Wildlife Monitoring and Conservation. Sensor 16 (1), Item 97.

Gillins, D., Parrish, C., Gillins, M., H. Simpson, C., 2018: Eyes in the Sky: Bridge Inspections with Unmanned Areal Vehicles. Oregon Dept. of Transportation, SPR 787 Final Report.

SenseFly, 2018: https://www.sensefly.com/drone/bee-mapping-drone/ (6.5.2018).

Silveira, L., Jacomo, A. & Diniz-Filho, J., 2003: Camera trap, line transect census and track surveys: a comparative evaluation. Biological Conservation 114 (3), 351-335.

Szegedy, C., Vanhoucke, V., Ioffe, S., Shlens, J., Wojna, Z., 2016: Rethinking the inception architecture for computer vision. Proceedings of the IEEE Conference on Computer Vision and Pattern Recognition 2016, 2818-2826.