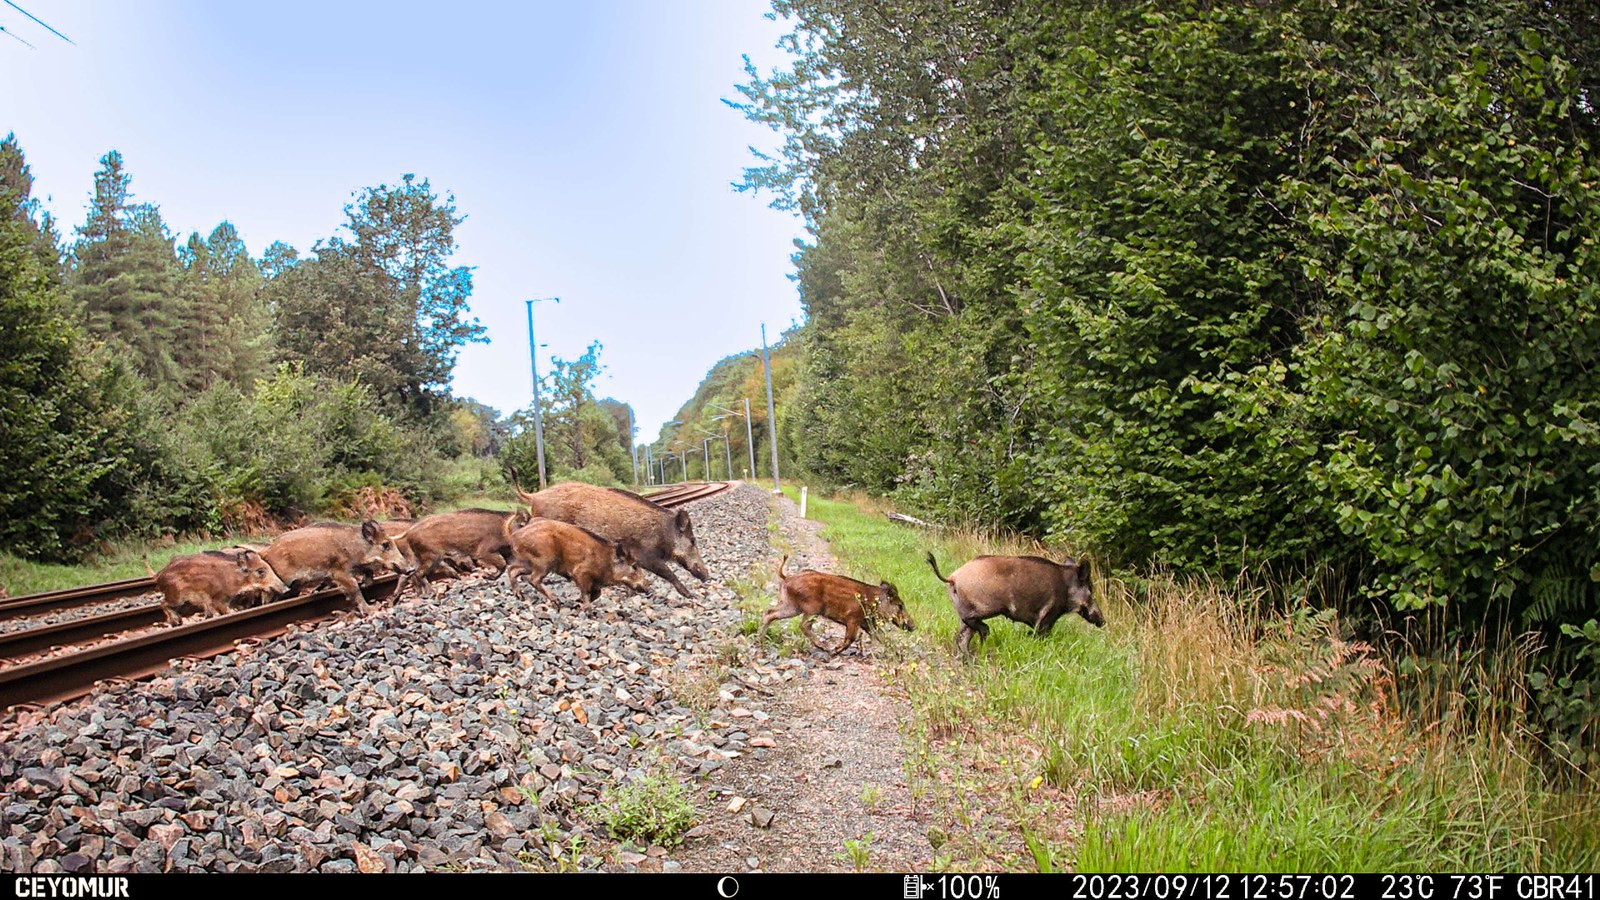
Where wildlife habitat meets railway traffic
Where do wild boar find suitable habitat, and which railway sections are most exposed to collisions? The research with SNCF Réseau connects these questions through two successive studies. Habitat modeling describes seasonally suitable landscapes. Collision modeling then examines how train traffic, infrastructure and access conditions shape encounters between animals and trains.
Satellite time series provide regularly updated information on forests, farmland and seasonal vegetation development. Combined with collision reports, other wildlife observations, terrain and hunting data, they create a consistent basis for comparison across the national network. The resulting maps help select sections for closer investigation and place local observations in their wider landscape context.

Habitats across years and seasons
Published in the European Journal of Wildlife Research on October 13, 2026, the habitat study combines rail and road collision records with GBIF observations. A Prithvi model adapted to multispectral satellite imagery produces annual land-cover maps at 30 m resolution. Resource, climate and landscape features derived from these data feed seasonal habitat models on a 1 km² grid. Source-specific weighting and thinning address differences in observation effort.
The clearest benefit of using several years of environmental information appeared when transferring to withheld years. For summer 2021, the area outside individual predictor ranges represented in training fell from approximately 32% to 5%. Habitat rankings did not improve consistently, but the models encountered unfamiliar environmental conditions much less often. Among the tested approaches, MaxEnt produced more stable rankings across years. These maps represent relative habitat suitability, rather than population density or calibrated occurrence probability.


Seasonal priorities tested across space
The second study models 7,106 cleaned collision records from 2015–2024 across 24,927 railway cells. It is available as an ARPHA preprint and is under review at Nature Conservation. Winter covers September through February, and summer March through August. Train frequency was the leading predictor in both seasons, complemented by terrain, infrastructure, habitat resources and hunting indicators.
The highest-ranked cells are particularly useful for prioritization. Under spatial checkerboard validation, the top 5% of cells contain 18.7% of winter collision-positive cells and 24.4% of summer collision-positive cells. These concentrations are 3.73 and 4.87 times those expected from random selection. The figures describe cells with recorded events, not collisions prevented.
Spatial transfer remains a crucial test. For the broad winter model, R² for the smoothed risk score falls from 0.805 with random splitting to 0.683 with checkerboard validation and 0.323 when large regions are withheld. Surfaces with 12 km smoothing support regional assessment, while 5 km smoothing retains more local differentiation for investigation. These scales describe the response being modeled; they are not estimates of animal movement distances.
Evidence [2]

Connecting maps with independent observations
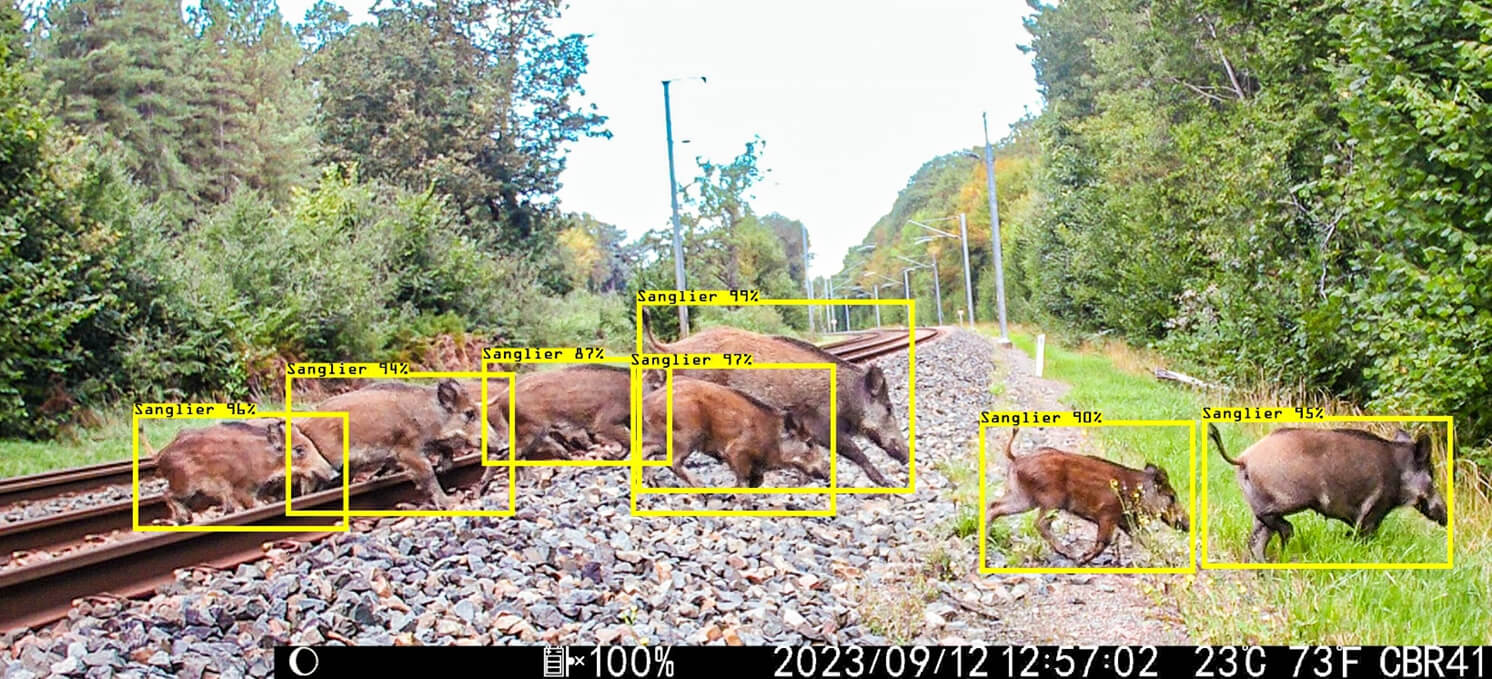
As of October 2026, the accompanying field collection is complete: approximately 2.5 million images from 100 camera-trap locations beside French railway lines span several years and seasons. Timestamps have been corrected and automated processing with MegaDetector and DeepFaune is complete. The next steps are manual review of detections and an ecological analysis that accounts for camera operating time and downtime. This will test how well the maps describe observed animal use of railway corridors.
Complementary work examines local access conditions. U-Net fence detection has already been applied to iMAJNET imagery from measurement locomotives, as a step toward a dated, validated inventory of fences and access points. An extension of hunting records into municipality-level time series is also being prepared with the Office français de la biodiversité. Both approaches will test which additional information helps explain local risk patterns.
SANGLIA and collaboration with SNCF
The SANGLIA research prototype brings seasonal rankings, incident histories and environmental information together in a map interface. It is designed to help specialists investigate railway sections using traceable evidence. Integration into an environmental GIS application at SNCF Réseau and evaluation of its practical benefits are planned. Subsections of approximately 100 m serve as inspection references; risk values retain the coarser spatial support of the model cells.
Close collaboration with SNCF underpins the project. Pascal Baran, now at Altametris and formerly at SNCF Réseau, supported its initiation, financing and network of contacts. Maxime Gombart provides continuing project guidance and expertise in hunting and wildlife management. Flavien Viguier contributes datasets, technical access and data-science input. Together with the scientific partners at FHNW and the University of Zurich, they connect modeling and fieldwork with railway operations.
Collaboration acknowledgments [1]
Methods in detail
- Derive annual land cover from satellite time series and combine rail, road and GBIF observations in seasonal habitat models.
- Connect collision records with train traffic, infrastructure, terrain, habitat resources and hunting indicators through LightGBM models.
- Test risk rankings with local and large-scale spatial validation, then investigate them further using independent field observations.


